
Our clients ask us all the time where they should be getting their website traffic from. They want to know how much should come from social, email, and organic traffic—and where they can improve. That’s where B2B website benchmarking can help.
While the answers are specific for each business and their target personas, HubSpot just released some great benchmark data on where other B2B and professional service organizations are generating traffic. You can use this as a terrific starting point to see how your website is performing.
HubSpot Research exported over a year’s worth of sources data from HubSpot customers and created website visit benchmarks across business type, employee size, region, and industry. Their report shows the proportion of total visits and average visits from each traffic source, from January 2014 through May 2015.
We’ve included several charts from the report below. You can check out all the data at HubSpot Research.
Traffic Source Benchmarking for B2B Websites
B2B Visitors
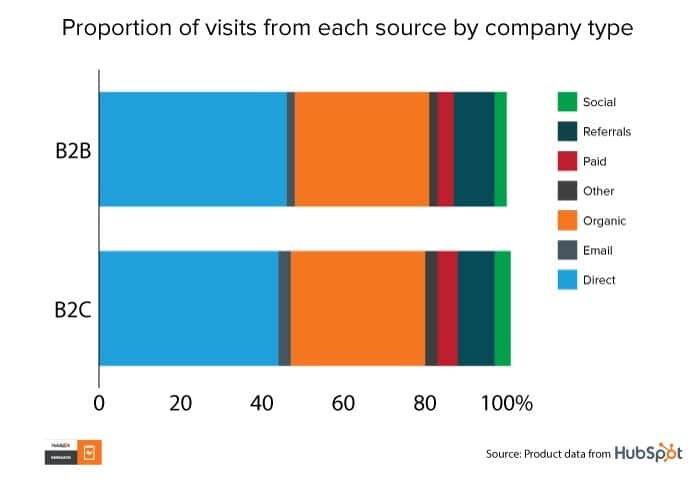

Perhaps surprisingly, B2B and B2C companies have nearly identical profiles when it comes to proportions of visits from various sources. By far, the greatest source of visits come from organic and direct traffic (although you should note this bit of info about “direct” traffic). Referrals are also significant. The fact that email is such a low contributor suggests that companies across the board have some improvements to make in their email marketing campaigns.
B2B Industry Website Benchmarking
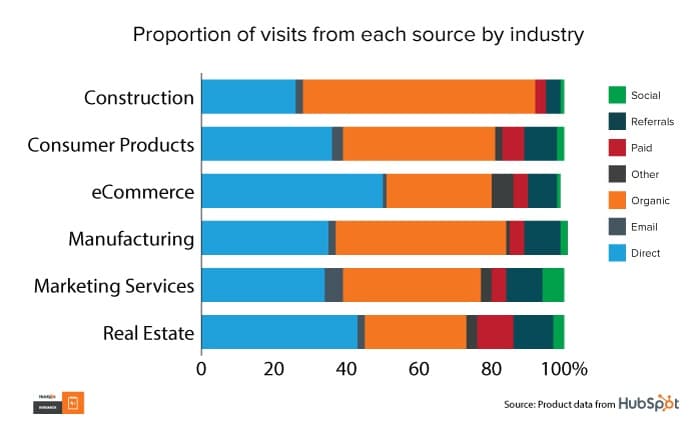

Here’s how it breaks down across B2B industries. Notice that marketing services get the most ROI on email campaigns, which makes sense if most B2B industries are underperforming in this area, as I guessed. You can have successful email campaigns, but it might help to have some expertise in the area.
Actual Monthly Numbers
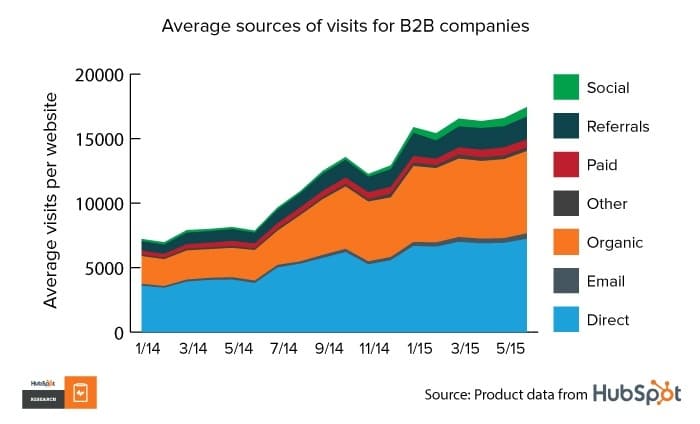
How do your numbers compare to these? Every B2B company is different, but this gives you a starting point to consider where you need to invest more attention when it comes to drawing more eyeballs to your website.
Company Size
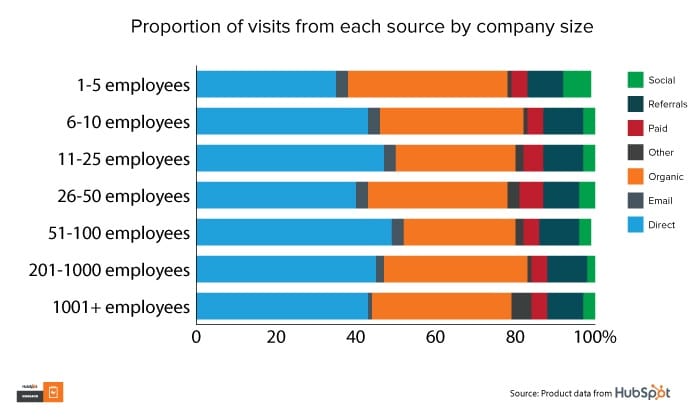
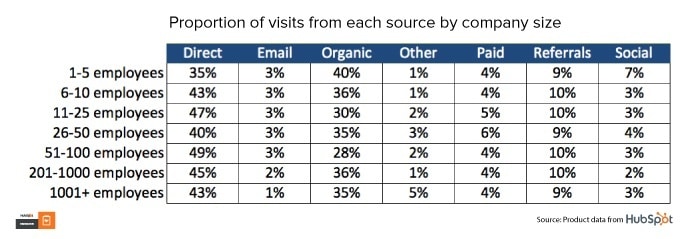
Size matters when it comes to B2B marketing. Here’s a quick breakdown of the proportion of source traffic for B2B companies of different sizes. You can go to the full report to see detailed charts showing numbers of visitors by company size.
But Maybe You Shouldn’t Attract More Visitors
Even if your numbers are lower than the industry standard, you might not need to focus on getting more traffic to your site. Check the shape of your sales funnel first, and figure out what stage of the funnel needs the most work. You might discover that fixing your leads problem ends up giving you more visitors too!
Still Looking For Answers? We Can Help!
Get the latest news
Blog Topics
- Analytics
- Branding & Identity
- Budget
- Construction
- Content Marketing
- Conversion Rate Optimization
- Email Marketing
- HubSpot
- Inbound Marketing
- Lead Generation
- Marketing Strategy
- News/Events
- Paid Search & PPC
- Recruiting
- Sales & Marketing
- Sales Enablement
- Search Engine Marketing
- Search Engine Optimization
- Social Media
- Thought Leadership
- Uncategorized
- Usability
- Video Marketing
- Web Hosting
- Website Design

